LUUM.IO
AMATIS - ANALYTICS GUIDE#
About This Guide#
Welcome to the analytics guide for the Amatis Lighting Control System. In this guide, you'll find straightforward explanations of the data graphing interface. Whether you're looking to see if a space was occupied yesterday, or see when the lights turned off last week, this guide will walk you through the process with ease.
Necessary Parts#
The following parts will be necessary to complete this guide:
- A functional Amatis lighting controls system
- Amatis/Luum devices active and reporting data
System Setup#
Before getting started with data graphing, ensure the site has an active internet connection. Once you are logged into the app and devices have been collecting historical data, analytics can begin.
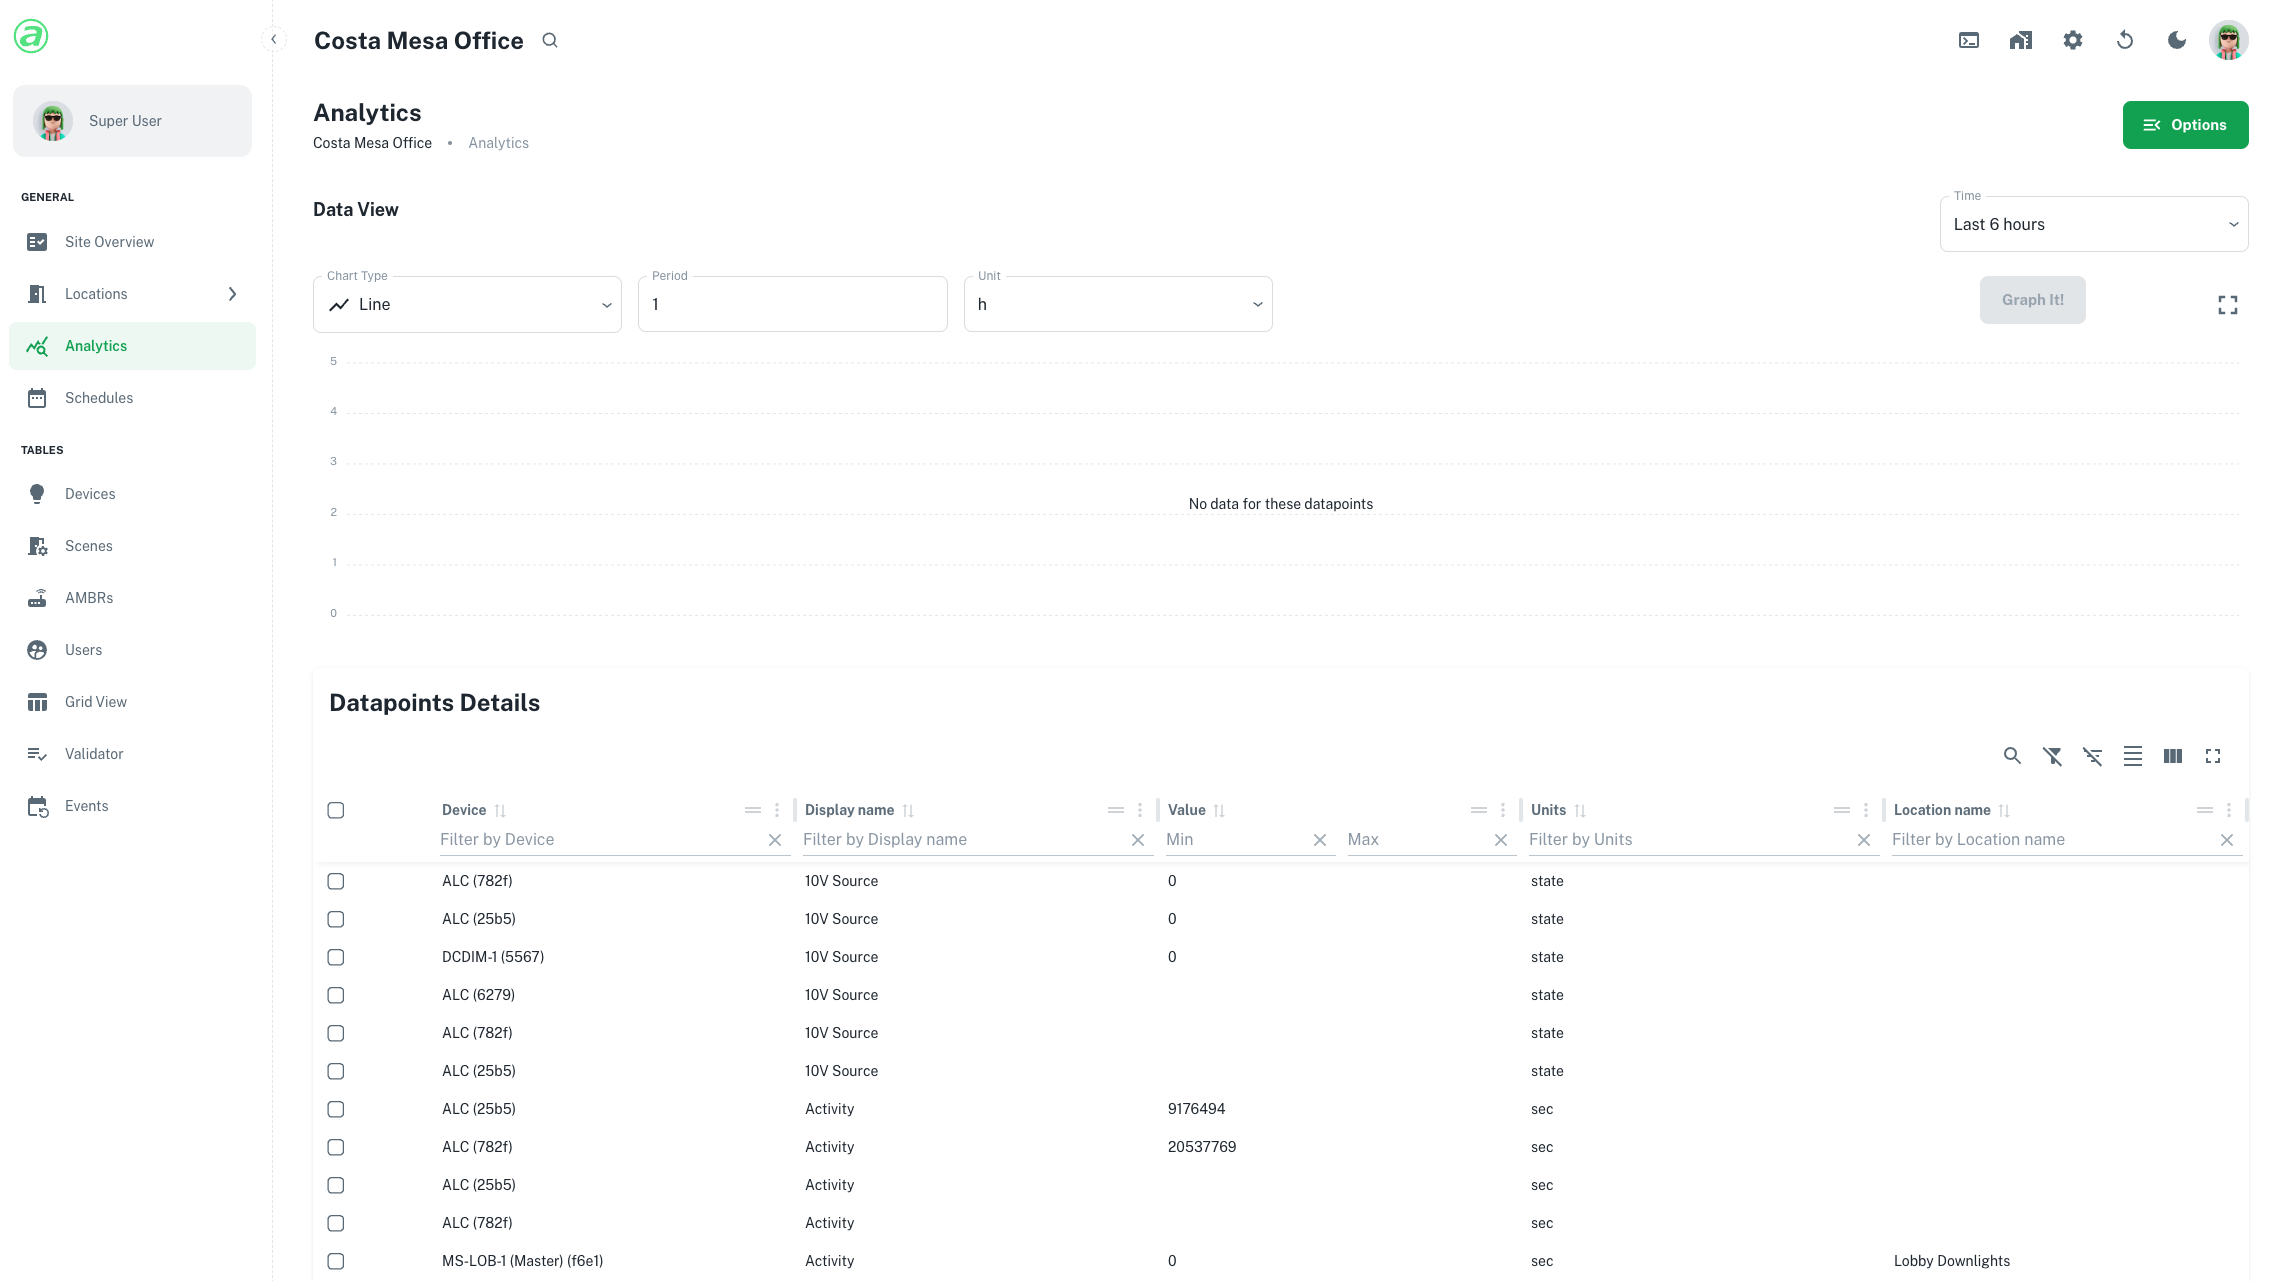
Selecting Datapoints#
Before graphing any data, datapoints need to be selected. Search by device and display name, and check the datapoint(s) to be graphed.
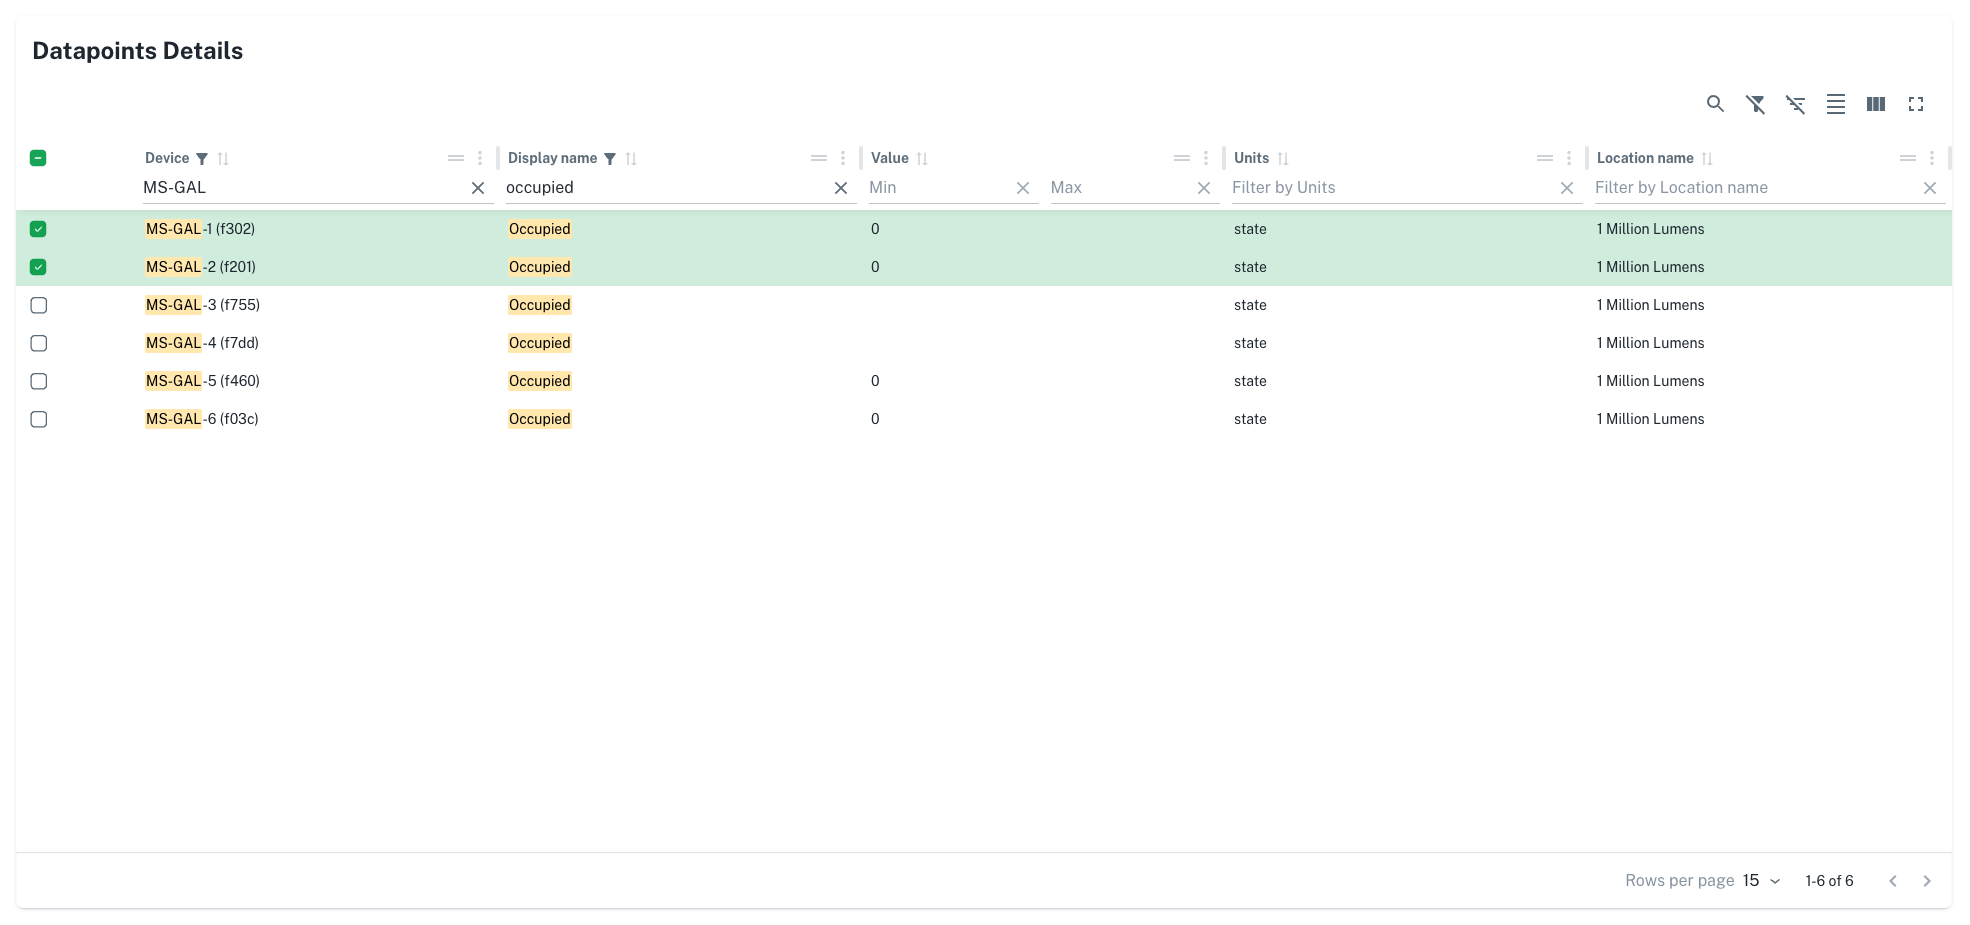
Devices are typically found by their name, ID (last four of their MAC address), or by searching for a location. "Display name" refers to the name of the datapoint. See the tables below for common datapoint names to search for:
X-PoE Datapoints#
| DATAPOINT NAMES | ||
|---|---|---|
| Energy ch[x] | Wh (Watt Hours) | Cumulative energy consumption for a channel (replace X with channel) |
| I ch[x] | A (Amps) | Current flowing through a channel (replace X with channel) |
| P ch[x] | W (Watts) | Power consumption of a channel (replace X with channel) |
| State ch[x] | % (Percentage) | Output level for a channel (replace X with channel) |
| State P[x] | % (Percentage) | Output level for a port (replace X with port) |
| V ch[x] | V (Volts) | Voltage measured for a channel (replace X with channel) |
Amatis Datapoints#
Advanced Load Controller (ALC)#
| DATAPOINT NAMES | ||
|---|---|---|
| Channel 1 | % (Percentage) | Output level for the 0-10V output |
| Current | A (Amps) | Current flowing through the device |
| Humid | % (Percent RH) | Humidity measured by the sensor2 (if connected) |
| Light | % (Percentage) | Light level measured by the sensor2 (if connected) |
| Occupied | State (1 or 0) | The occupancy state of the sensor2 (if connected) |
| Power | W (Watts) | Power consumption of the device |
| Relay | State (1 or 0) | Open/close state of the relay |
| Temp | °C (Degrees Celsius) | Temperature measured by the sensor2 (if connected) |
| Voltage | V (Volts) | Voltage measured by the device |
DCDIM#
| DATAPOINT NAMES | ||
|---|---|---|
| Current | A (Amps) | Current flowing through the device |
| DAC | % (Percentage) | DAC output level of the device |
| Power | W (Watts) | Power consumption of the device |
| PWM | % (Percentage) | PWM output level of the device |
| Voltage | V (Volts) | Voltage measured by the device |
DRIVER#
| DATAPOINT NAMES | ||
|---|---|---|
| Channel 1 | % (Percentage) | Output level for the device |
| Humid | % (Percent RH) | Humidity measured by the sensor2 (if connected) |
| Light | % (Percentage) | Light level measured by the sensor2 (if connected) |
| Occupied | State (1 or 0) | The occupancy state of the sensor2 (if connected) |
| Power | W (Watts) | Power consumption of the device |
| Temp | °C (Degrees Celsius) | Temperature measured by the sensor2 (if connected) |
Power Hub Driver (PHD)#
| DATAPOINT NAMES | ||
|---|---|---|
| Ih ch[x] | A (Amps) | Current flowing through a channel (replace X with channel) |
| P ch[x] | W (Watts) | Power consumption of a channel (replace X with channel) |
| St ch[x] | % (Percentage) | Output level for a channel (replace X with channel) |
| St zn-[x] | % (Percentage) | Output level for a 0-10V zone (replace X with zone) |
| Vh ch[x] | V (Volts) | Voltage measured for a channel (replace X with channel) |
| Vin | V (Volts) | Input voltage measured for the device |
Sensor1 (MLTH)#
| DATAPOINT NAMES | ||
|---|---|---|
| Channel 1 | % (Percentage) | Output level for the 0-10V output |
| Humid | % (Percent RH) | Humidity measured by the sensor |
| Light | % (Percentage) | Light level measured by the sensor |
| Occupied | State (1 or 0) | The occupancy state of the sensor |
| Temp | °C (Degrees Celsius) | Temperature measured by the sensor |
Graphing Data#
Once datapoints have been selected, the data can be graphed. Select "Graph It!" to graph the data.
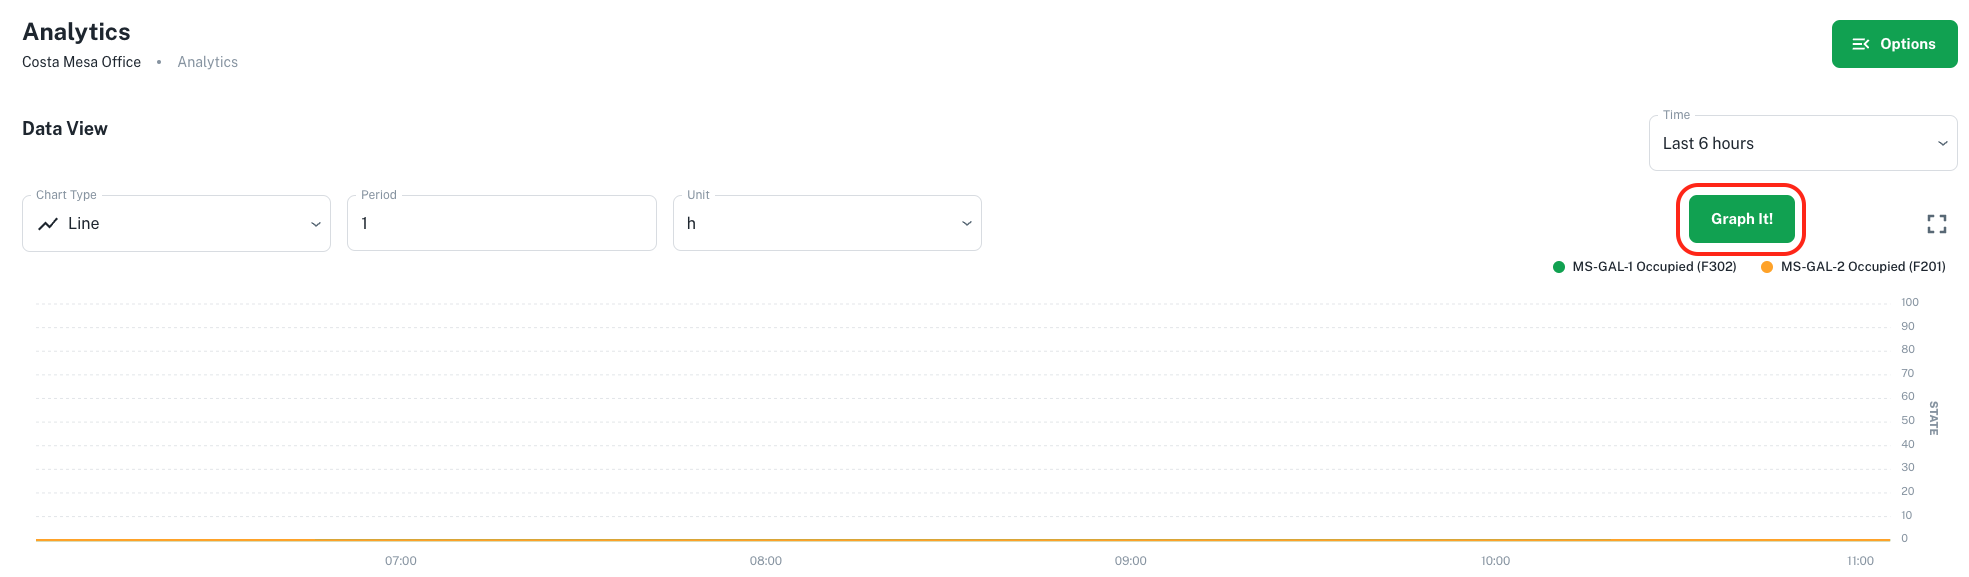
The chart type, period, unit, and time can all be adjusted using the options above the graph.
- Adjust the "Time" option to choose when data should be displayed from.
- Adjust the "Unit" option to see data on a more or less granular level.
- Highlight the graph horizontally to zoom in on a shorter period of time.
These are just some of the ways to customize the graph and view data in various ways.
Graph Options#
Select the "Options" button in the top right to view additional graphing options.
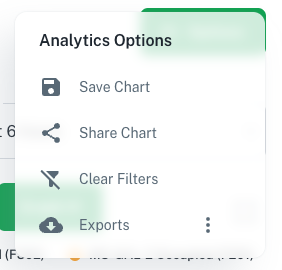
- "Save Chart" allows the chart to be saved and viewed later.
- "Share Chart" generates a link to the chart to be shared with others.
- "Clear Filters" clears all the filters and resets the chart.
- "Exports" allows the chart to be exported as a csv or image file.